

VCF Inspector Fling: fleet-level pre-upgrade and health diagnostics
VCF only. Every mode connects to either SDDC Manager or a VCF Services Runtime control-plane VM – layers that only exist in a fleet driven through VCF Management Services. A standalone VVF or plain vSphere environment has nothing for it to point at.
A standalone, no-install binary that runs on an admin workstation or jumpbox, rather than a vCenter/PSC-level tool like VDT and lsdoctor – VCF Inspector operates at the fleet layer instead, which is exactly the layer where the patching failures documented in Patching an existing VCF 9.1 fleet happen (stuck lifecycle tasks, components silently deadlocked behind an apparent “Healthy” status). Launching the binary opens its own standalone application window with a web-style UI (light/dark theme toggle in the header) rather than a terminal TUI – it does not open in the system browser, despite the web-app look and its own “browser local storage” wording (below) suggesting an embedded webview under the hood. Per its own landing screen: “All communication is local to your machine. Credentials are never stored to disk.”
Field-observed (v1.300, own lab environment) – the landing screen presents three use-case cards, each connecting to a different VCF infrastructure layer:
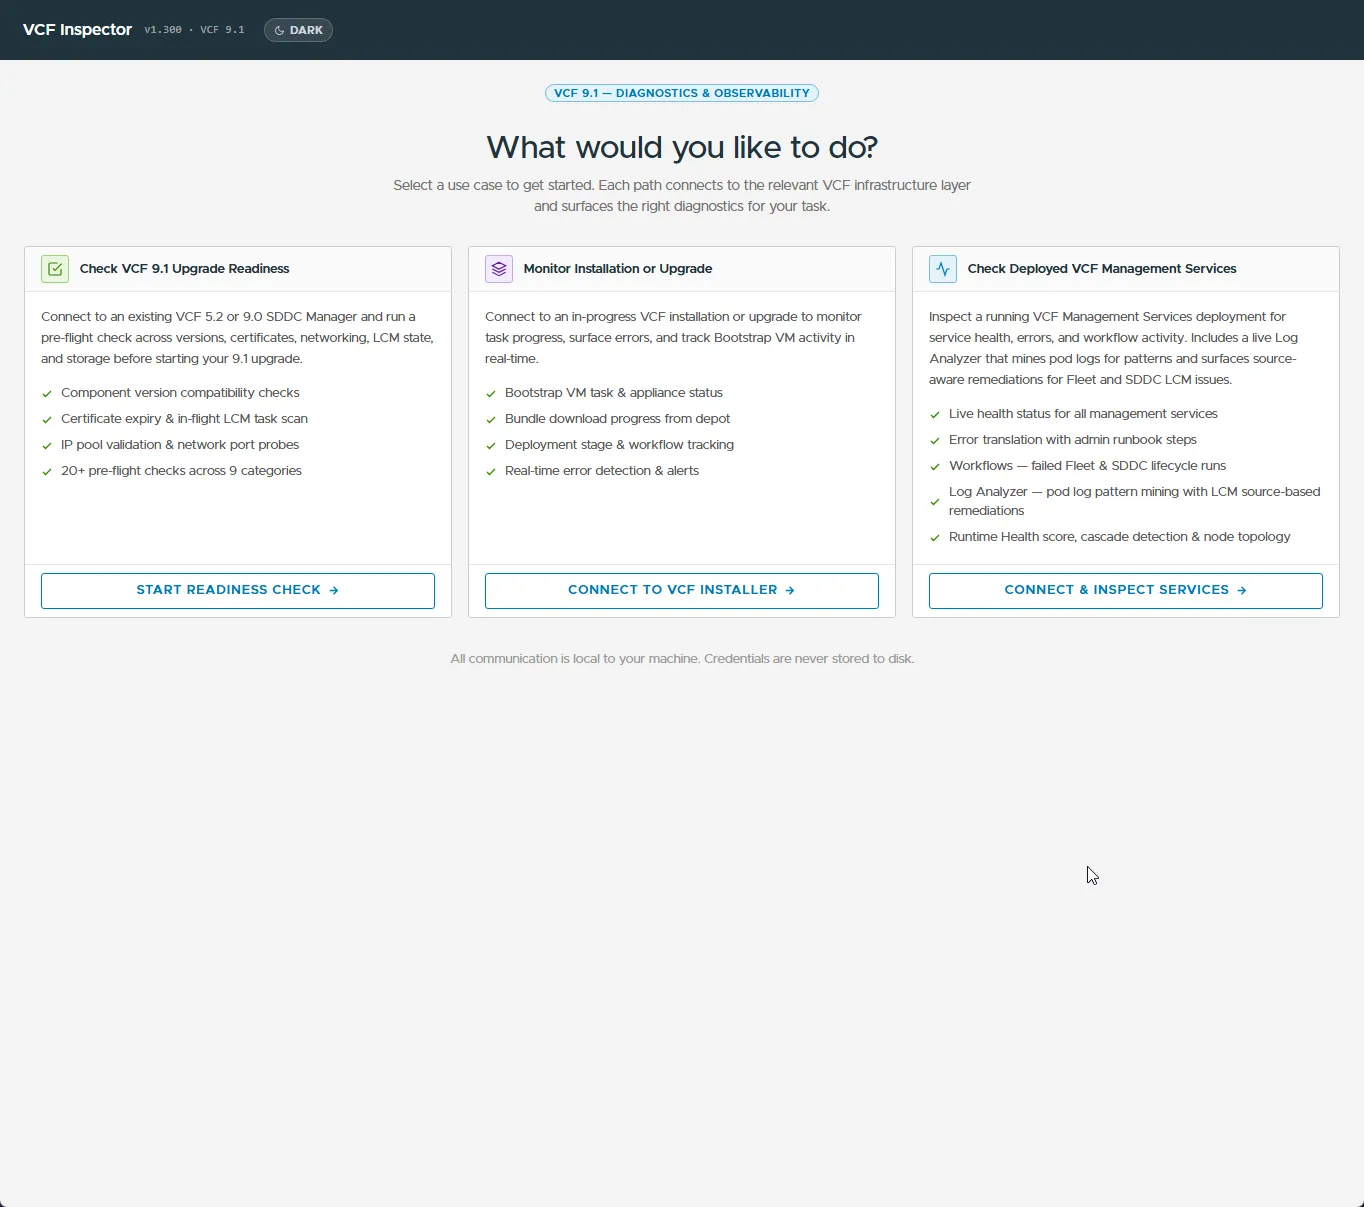
- Check VCF 9.1 Upgrade Readiness – connects to an existing VCF 5.2 or 9.0 SDDC Manager and runs a pre-flight check before starting a 9.1 upgrade: component version compatibility, certificate expiry and in-flight LCM task scan, IP pool validation and network port probes – 20+ pre-flight checks across 9 categories. This targets the same moment as the prerequisites tables in Full VCF upgrade sequence – a source on 5.2 or 9.0.x heading to 9.1, not a 9.1.0.x → 9.1.1 patch – run it as a second, independent confirmation, not a replacement.
- Monitor Installation or Upgrade – connects to an in-progress VCF installation or upgrade (button: Connect to VCF Installer) to track Bootstrap VM task and appliance status, bundle download progress from the depot, deployment stage/workflow tracking, and real-time error detection and alerts.
- Check Deployed VCF Management Services – inspects an already running VCF Management Services deployment: live health status for every management service, error translation with admin runbook steps, workflows for failed Fleet/SDDC lifecycle runs, a Runtime Health score with cascade detection and node topology, and a live Log Analyzer that mines pod logs for patterns and surfaces source-aware remediations for Fleet and SDDC LCM issues – not mentioned in the official announcement blog at all. This is the capability most relevant to the Upgrade All failure account – a 13-day silent deadlock that the fleet’s own UI reported as “Healthy” the whole time. A tool built for cascade detection and live log pattern mining is the kind of second opinion that account’s after-the-fact recovery would have benefited from.
This is a VMware Fling, not officially supported production software. Treat it as a diagnostic aid, not a gate the patch process depends on, and expect rough edges – feedback goes back through the Flings community channel it ships with. That caveat carries more weight than it would for a purely read-only tool: the Management Services Inspector’s Actions tab (below) executes real cluster-wide remediation – DNS restarts, credential renewal, database compaction – against the live environment, not just diagnostics.
Download and setup
Download the platform-matching binary from the Broadcom Support Portal Free Downloads / Flings section (search for VCF Inspector) – no installer, no appliance to deploy:
| Platform | Binary |
|---|---|
| macOS (Apple Silicon) | vcf-inspector-darwin-arm64-native |
| Linux (x86_64) | vcf-inspector-linux-amd64 |
| Windows (x86_64) | vcf-inspector-windows-amd64-native.exe |
macOS/Linux:
chmod +x ./vcf-inspector-darwin-arm64-native
./vcf-inspector-darwin-arm64-native
Windows: double-click the .exe.
Each of the three modes connects to a different target with different credentials – there’s no single generic login. Field-observed (v1.300):
- Check VCF 9.1 Upgrade Readiness connects to SDDC Manager.
Select the current VCF version first (a toggle: VCF 5.2.x or
VCF 9.0.x – no 9.1 option, since this mode is specifically for a
pre-9.1 source assessing readiness to move to 9.1), then supply the
SDDC Manager IP/hostname (port suffix supported for non-standard
ports, e.g.
10.0.0.1:9004) and an SSO admin login (placeholderadministrator@vsphere.local). Button: Connect & Run Pre-Flight Check. - Monitor Installation or Upgrade also connects to SDDC Manager
(IP/FQDN,
admin+ the SDDC Manager password) – but unlike the other two modes, it needs no separate Bootstrap VM credentials: “The Bootstrap VM is auto-discovered via SDDC Manager.” Button: Connect & Monitor. - Check Deployed VCF Management Services connects somewhere entirely
different: SSH directly to a VCF Services Runtime control plane VM
(not SDDC Manager), default username
vmware-system-user, with an Advanced Connection Options section for a non-default SSH port and an optional pasted SSH private key (PEM) in place of a password. It also surfaces a callout pointing at VCF Operations’ own Health Dashboard as a suggested first check before connecting here at all. Button: Connect & Inspect.
All three forms offer a Save connection option, and a prior session’s saved connections reappear as chips on return visits (e.g. a saved IP) – so despite the tool’s own framing, some connection state does persist between runs.
Credential-storage claims are inconsistent across screens, and that matters before pointing this at anything sensitive. The landing page’s blanket claim is “Credentials are never stored to disk.” The Management Services Inspector screen’s own footer instead says “Credentials are stored in browser local storage only” – a materially different claim (browser local storage is disk-backed, just sandboxed to the app’s origin) that directly contradicts the landing page one screen up. Unresolved as of v1.300 – until VMware clarifies which is accurate, treat any saved connection/credential as retained somewhere on the machine running the tool, and don’t save credentials for a production control-plane node on a shared workstation.
Supported source versions: the announcement blog describes the tool
as built for VCF 9.1, but the readiness-check mode’s own version toggle
(v1.300) only offers VCF 5.2.x or VCF 9.0.x as the source being
assessed – i.e. this mode is for a pre-9.1 fleet checking readiness to
reach 9.1, not for validating a fleet already on 9.1. The other two
modes (Deployment Monitor, Management Services Inspector) do target VCF
9.1 itself, per their header badges (VCF 9.1). Confirm which mode
matches the source version actually in play before relying on it.
Field-observed: Management Services Inspector walkthrough (lab environment)
Once connected, the header’s Use Cases link becomes a Menu dropdown, and four tabs appear alongside always-present Support Bundle and Data Capture buttons: Services, Runtime Health (not captured here), Advanced Troubleshooting, and Actions.
A recurring UI pattern across all three tabs: multiple status chips
appear side by side rather than one resolved verdict – e.g. Backup
shows Checking... / OK / Not Configured together, Database Cluster
Health shows 3 clusters healthy and No clusters found together,
Workflows shows Checking... / 2 running / All clear together. Read
the detail panel or the underlying number, not just the badge set, before
concluding a section is fine or broken.
Services tab
- Top-line summary: Total Services / Online / Degraded / Critical counts (observed: 8 / 8 / 0 / 0).
- Platform IP Pool: allocation bar (total/assigned/orphaned/free), a sizing callout confirming the pool meets VCF Services Runtime’s 12–30 IP requirement and how many more scale-out nodes the free balance supports (2 IPs per node for Node IP + Pod CIDR), and an expandable exact navigation path to expand it – this corroborates and extends the UI path documented in Patching an existing VCF 9.1 fleet, Step 3: log into VCF Operations as Administrator, Build → Lifecycle → VCF Management, select VCF Services Runtime, actions menu → Expand Node IP Pool.
- Virtual IPs table: Control Plane VIP, VCF Services Runtime FQDN, Fleet Components FQDN, Instance Components FQDN, VIDB FQDN, and Log Management FQDN, each with its own IP – confirms these are distinct addressable endpoints, not aliases of one shared VIP.
- Node IP Assignments table: every node’s name, role (Control Plane / Worker Node), and IP.
- Deployed Services (8 cards observed): grouped by category –
Lifecycle Management (SDDC Lifecycle Manager, Fleet Lifecycle
Manager, Software Depot), VCF Salt Services, Identity
(Identity Broker), Telemetry, Realtime Metrics, Logging
(Log Management) – each card shows an internal short name (
SDDC LCM,Fleet LCM,vidb-external,Telemetry Acceptor,Ops for Logs (mops), etc.), a one-line description, and an Online/Degraded/Critical badge. VCF Automation and the Migration Service Engine did not appear in this lab’s 8-service list – consistent with VCF Automation running its own separate deployment rather than being one of the 8 fleet-wide VCF Services Runtime services (though a field-verified fact from the sister repo confirms Automation’s lifecycle operations do authenticate against this same fleet-wide runtime, not a separate Automation-specific one). This is also the highest-risk, most complex pair in docs/20’s patching order, which moves both to the end for that reason. Open question, untested (issue #27): whether pointing this same connect form at a VCF Automation control-plane node (rather than the VCF Services Runtime one) would also work – the form only asks for a generic control-plane IP and SSH credentials, but the Services tab and Log Analyzer only surfaced the 8 fleet-wide services here, so it’s unconfirmed whether Automation’s own components would even be recognized. - Control Plane Nodes: per-node CPU/memory gauges and a System
Services list flagging any service in a bad state – field-observed
5 flagged services on one node:
kube-controller-manager,kube-scheduler,kube-vip-<node>,vsphere-cpi,vsphere-csi-controller(all taggedsys). - VCF Management Services Backup – directly relevant to patching. Fields: SFTP Storage Target, Last Backup Timestamp, Status. Field observed “No backup found” with an explicit warning: “Automated backups for VCF Management Services are either not configured or the last backup attempt failed or is older than 24 hours. Ensure SFTP automated backups are configured prior to executing updates or configuration changes.” This is the same automatic pre-patch backup mechanism documented in Patching an existing VCF 9.1 fleet, Backup before patching – checking this panel before opening a patch window is a faster confirmation than digging through Build → Lifecycle → VCF Management → Backup & Restore by hand.
- NTP Synchronisation: per-node offset table. Field-observed anomaly: every node showed an offset of ~0.0ms yet was still badged “Not Synced” – don’t treat the badge alone as a live drift alarm; check the offset value first.
- Other panels observed, collapsed by default: Volumes/Disks (PVC bound count), VCF Services Runtime Tasks (active task count), Node Placement (spread/zone status), Database Cluster Health, Platform Package Status (packages ready count), Platform Engine & Core Stability (probe count).
Advanced Troubleshooting tab
Framed in its own intro callout as “deeper diagnostic tools… most useful when working with VMware Support to identify root causes or accelerate case resolution” – i.e. escalation-tier detail, not the first place to look.
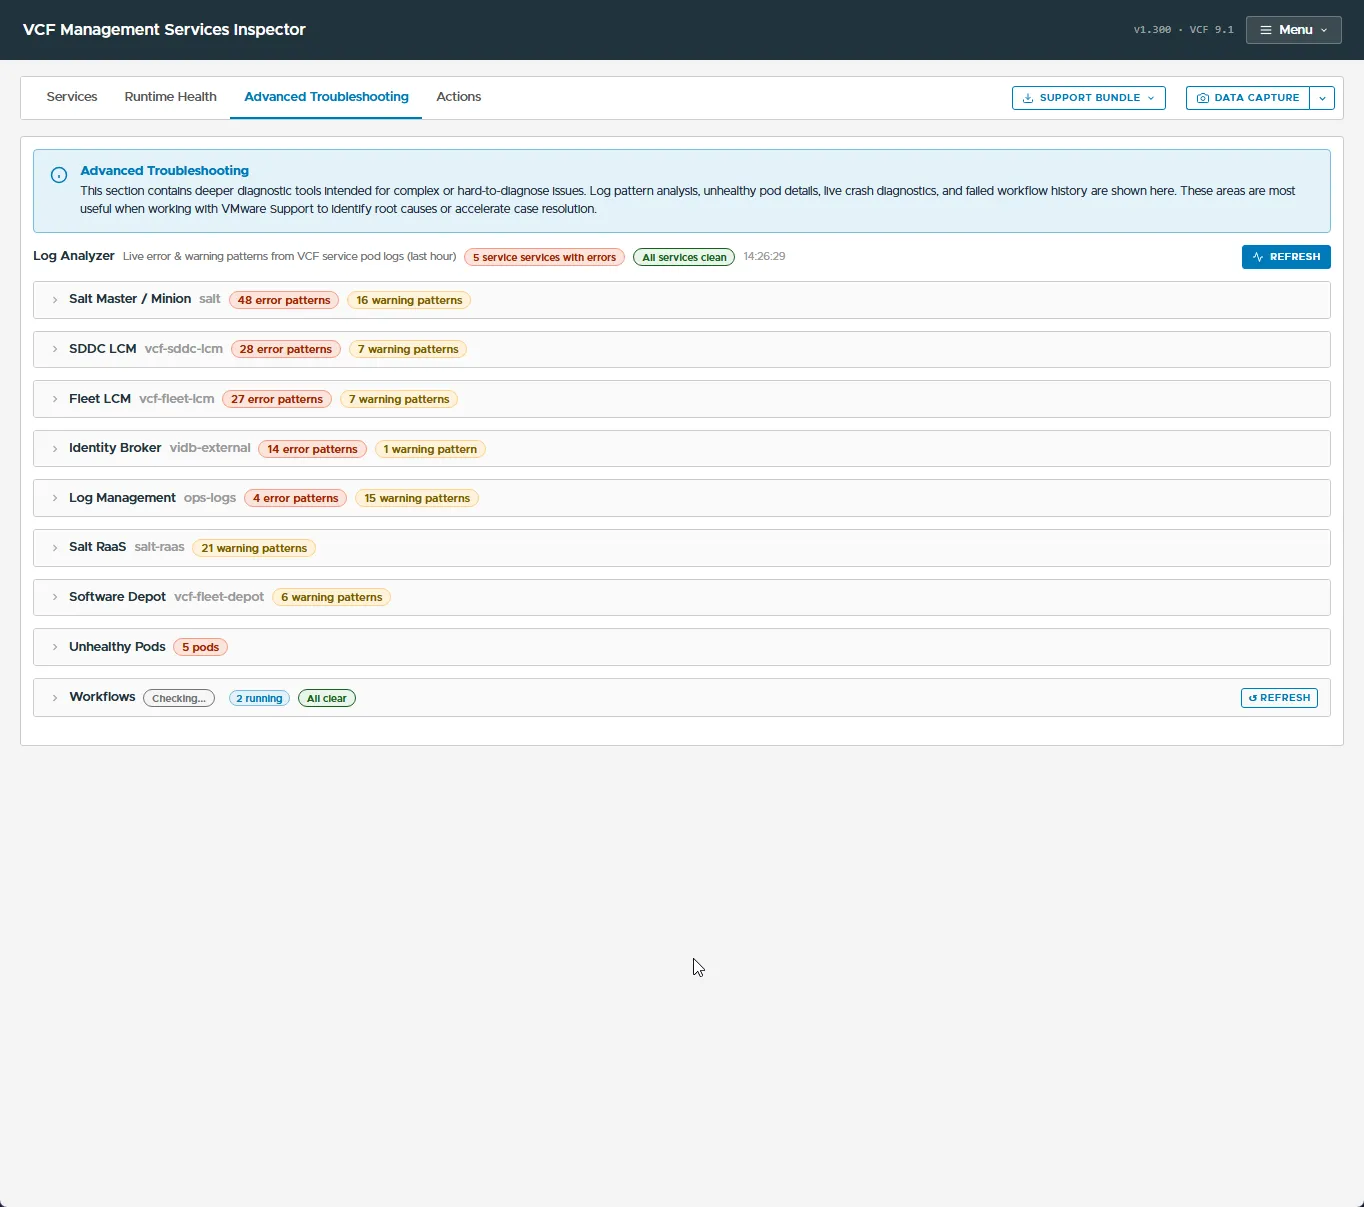
- Log Analyzer – “Live error & warning patterns from VCF service pod logs (last hour)”, refreshable, broken down per service with its internal short name and separate error/warning pattern counts. Field-observed counts (a snapshot, not necessarily representative): Salt Master/Minion 48 errors / 16 warnings, SDDC LCM 28/7, Fleet LCM 27/7, Identity Broker 14/1, Log Management 4/15, Salt RaaS 0/21, Software Depot 0/6. High counts here don’t necessarily mean the service is unhealthy on their own – cross-check against the Services tab’s Online/Degraded/Critical badge for that same service before treating a pattern count as an active problem.
- Unhealthy Pods – a count with drill-down (field-observed: 5 pods).
- Workflows – failed/running Fleet and SDDC lifecycle workflow history, refreshable.
Actions tab
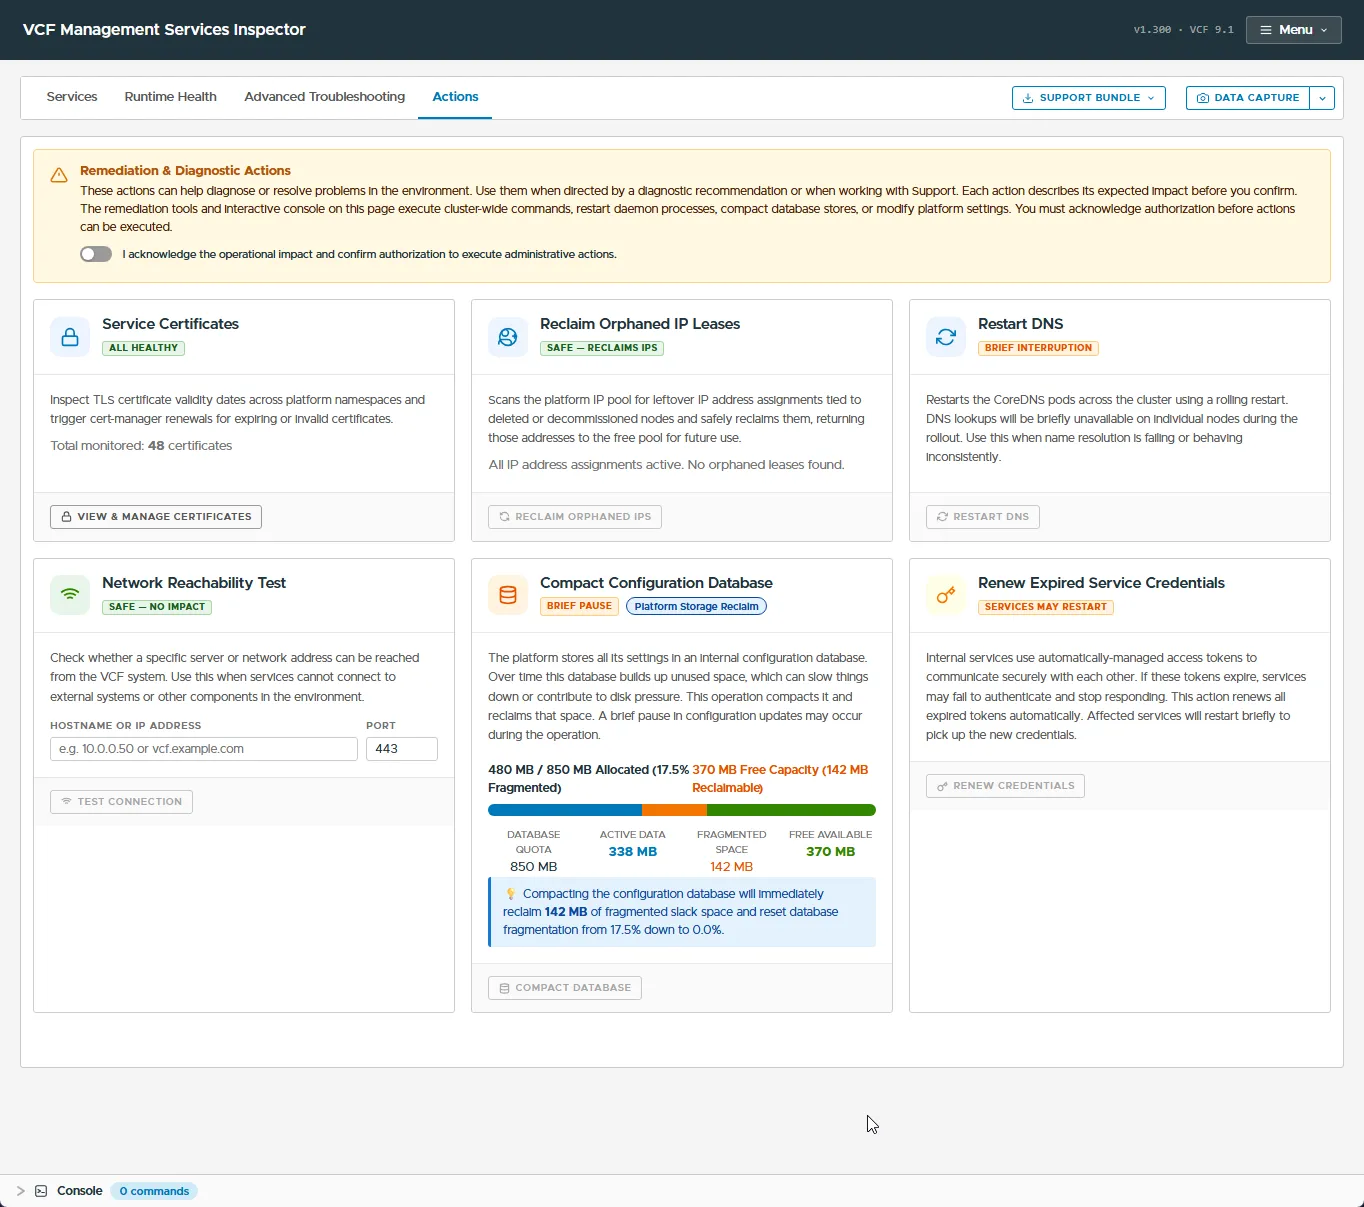
This tab executes real remediation against the live environment, not just diagnostics – closer to lsdoctor’s repair modes than to VDT’s read-only sweep, and gated behind an explicit consent toggle: “I acknowledge the operational impact and confirm authorization to execute administrative actions.” Per its own warning banner: “The remediation tools and interactive console on this page execute cluster-wide commands, restart daemon processes, compact database stores, or modify platform settings.” Six actions observed, each carrying its own impact badge:
| Action | Impact badge | What it does |
|---|---|---|
| Service Certificates | All healthy | Inspects TLS cert validity across platform namespaces and can trigger cert-manager renewals for expiring/invalid certs (48 certificates monitored in this lab) |
| Reclaim Orphaned IP Leases | Safe – reclaims IPs | Scans the platform IP pool for leases tied to deleted/decommissioned nodes and reclaims them |
| Restart DNS | Brief interruption | Rolling restart of CoreDNS pods cluster-wide; per-node DNS lookups briefly unavailable during rollout |
| Network Reachability Test | Safe – no impact | Tests whether a given hostname/IP:port is reachable from the VCF system |
| Compact Configuration Database | Brief pause (platform storage reclaim) | Compacts the internal config database and reclaims fragmented space; a brief pause in config updates may occur |
| Renew Expired Service Credentials | Services may restart | Renews expired inter-service auth tokens; affected services restart briefly to pick up new credentials |
The Compact Configuration Database panel also surfaces live capacity
numbers (quota, active data, fragmented space, free available, percent
fragmented) before you commit to running it – worth checking that number
before assuming it needs to run. A collapsed Console panel sits below
the action cards (0 commands in this lab) – an interactive command
console, not explored further here.
Sources
- VCF Inspector Fling (official VMware Cloud Foundation blog) – announcement, capabilities, download location, and usage